Nordic Innovation report maps the global supply chain for critical and strategic raw materials (CSRMs), listing top-three producers by material and processing stage across 34 countries. China leads in 28+ entries across mining, refining, and smelting—including aluminum smelting (60.8%), cobalt refining (79.7%), rare earths mining (69.2%), graphite mining (77.8%), and tungsten mining (78.8%). The Democratic Republic of Congo dominates cobalt mining (74.2%) and tantalum mining (52%), while South Africa controls platinum mining (70.6%) and palladium mining (36.8%). The United States leads in beryllium mining (53.5%) and helium production (81 million m³). This supply chain map reveals extreme geographic concentration across multiple CSRMs, highlighting Europe's structural dependence on a limited number of producer countries.Data source: USGS MCS 2026, BGS World Mineral Statistics 2023, SCREEN3 2025, Johnson Matthey
Global CSRM Top-Three Producers by Material and Processing Stage
| Country |
Material (Stage) – Rank & Share |
| 1. Canada | Cobalt (Refinery) (3) 2.8% • Niobium (Mining) (2) 8.2% • Palladium (Mining) (3) 8.4% |
| 2. USA | Beryllium (Mining) (1) 53.5% • Borates (Mining) (2) 25.7% • Germanium metal (Production) (2) 2.8% • Hafnium (Processing) (2) 44% • Helium (Production) (1) 81M m³ • Phosphate rock (Mining) (3) 8% • Rare earths (Mining) (2) 13.1% |
| 3. Mexico | Fluorspar (Mining) (2) 15% |
| 4. Peru | Arsenic trioxide (Production) (1) 49.2% • Copper (Mining) (3) 11.7% |
| 5. Chile | Copper (Mining) (1) 23% • Copper (Smelting/refining) (3) 5.9% • Lithium (Mining) (3) 19.3% |
| 6. Brazil | Beryllium (Mining) (2) 18.6% • Magnesium metal (Smelter) (3) 1.8% • Niobium (Mining) (1) 89.9% • Silicon metal (Smelting/refining) (2) 3.9% • Vanadium (Mining) (3) 4.8% |
| 7. South Africa | Helium (Production) (3) 18M m³ • Manganese (Mining) (1) 38% • Palladium (Mining) (1) 36.8% • Platinum (Mining) (1) 70.6% • Rhodium (Mining) (1) 80% • Titanium ilmenite (Mining) (3) 13.3% |
| 8. Madagascar | Graphite (Mining) (2) 4.4% |
| 9. Mozambique | Titanium ilmenite (Mining) (2) 19.4% |
| 10. Zimbabwe | Platinum (Mining) (3) 10.6% • Rhodium (Mining) (3) 5% • Graphite (Mining) (3) 4.2% |
| 11. Rwanda | Tantalum (Mining) (2) 16% |
| 12. Congo (Kinshasa) | Cobalt (Mining) (1) 74.2% • Copper (Mining) (2) 13.9% • Copper (Smelting/refining) (2) 9.7% • Tantalum (Mining) (1) 52% |
| 13. Gabon | Manganese (Mining) (2) 25% |
| 14. Nigeria | Tantalum (Mining) (3) 15.6% |
| 15. Ghana | Manganese (Mining) (3) 10% |
| 16. Guinea | Bauxite (Mining) (1) 34.1% |
| 17. Morocco | Arsenic trioxide (Production) (3) 8.2% • Baryte (Mining) (3) 11.5% • Phosphate rock (Mining) (2) 14.4% |
| 18. Spain | Strontium (Mining) (2) 22.2% |
| 19. France | Hafnium (Processing) (1) 49% |
| 20. Norway | Silicon metal (Smelting/refining) (3) 2.8% |
| 21. Finland | Cobalt (Refinery) (2) 6% |
| 22. Russia | Aluminum (Smelter) (3) 5.3% • Antimony (Mining) (2) 29.1% • Cobalt (Mining) (3) 2.5% • Gallium (Primary prod.) (2) 0.7% • Germanium (Production) (3) 2.4% • Magnesium metal (Smelter) (2) 5.5% • Nickel (Mining) (3) 5.1% • Nickel (Smelting/refining) (3) 4.6% • Palladium (Mining) (1) 44.2% • Platinum (Mining) (2) 11.8% • Rhodium (Mining) (2) 12% • Titanium sponge (Processing) (3) 6.8% • Vanadium (Mining) (2) 19.1% |
| 23. Turkey | Borates (Mining) (1) 35.4% • Feldspar/Nepheline syenite (Mining) (2) 17.1% |
| 24. Israel | Magnesium metal (Smelter) (3) 1.8% |
| 25. Iran | Bismuth (Refinery) (2) 6.2% |
| 26. Kazakhstan | Borates (Mining) (3) 9.9% • Tungsten (Mining) (3) 2.8% |
| 27. Tajikistan | Antimony (Mining) (3) 20% |
| 28. Qatar | Helium (Production) (2) 63M m³ |
| 29. China | Aluminum (Smelter) (1) 60.8% • Antimony (Mining) (1) 36.4% • Arsenic trioxide (Production) (2) 39.3% • Baryte (Mining) (2) 25.3% • Bauxite (Mining) (3) 19.8% • Beryllium (Mining) (3) 17.9% • Bismuth (Refinery) (1) 87.5% • Cobalt (Refinery) (1) 79.7% • Copper (Smelting/refining) (1) 48.3% • Fluorspar (Mining) (1) 60% • Gallium (Primary prod.) (1) 99% • Germanium (Production) (1) 94.8% • Graphite (Mining) (1) 77.8% • Hafnium (Processing) (3) 3% • Lithium (Mining) (2) 21.4% • Magnesium metal (Smelter) (3) 18.4% • Nickel (Smelting/refining) (2) 28.5% • Phosphate rock (Mining) (1) 44% • Rare earths (Mining) (1) 69.2% • Scandium oxide (Processing) (1 est.) ~80-90% • Silicon metal (Smelting/refining) (1) 87% • Strontium (Mining) (3) 17.8% • Titanium ilmenite (Mining) (1) 32.7% • Titanium sponge (Processing) (1) 70.3% • Tungsten (Mining) (1) 78.8% • Vanadium (Mining) (1) 74.5% |
| 30. India | Aluminum (Smelter) (2) 5.7% • Baryte (Mining) (1) 34.5% • Feldspar/Nepheline syenite (Mining) (1) 19.4% |
| 31. Vietnam | Tungsten (Mining) (2) 3.5% |
| 32. Mongolia | Fluorspar (Mining) (3) 15% |
| 33. Korea, Republic of | Bismuth (Refinery) (2) 6.2% |
| 34. Japan | Bismuth (Refinery) (3) 3.1% • Gallium (Primary prod.) (3) 3.1% • Scandium oxide (Processing) (3 est.) n.a. • Titanium sponge (Processing) (2) 14.3% |
Note: (1), (2), (3) indicate production share rank among listed countries. Dark blue countries are top-three global producers for at least one material.
Data source: USGS MCS 2026, BGS World Mineral Statistics 2023, SCREEN3 2025, Johnson Matthey
From the global CSRM supply chain map, three key observations emerge:
China holds dominant positions across 28+ supply chain entries. China ranks first in aluminum smelting (60.8%), cobalt refining (79.7%), rare earths mining (69.2%), graphite mining (77.8%), tungsten mining (78.8%), vanadium mining (74.5%), gallium primary production (99%), germanium production (94.8%), bismuth refining (87.5%), silicon metal smelting (87%), titanium sponge processing (70.3%), and fluorspar mining (60%). This multi-material, multi-stage dominance gives China unique structural leverage in global CSRM supply chains. As the report notes, export restrictions on gallium, germanium, antimony, and tungsten "can directly constrain defence-industrial availability when affected materials are used in magnets, batteries, shielding, electronics and aerospace systems."
Africa plays a critical role in upstream CSRM supply. The Democratic Republic of Congo dominates cobalt mining (74.2%) and tantalum mining (52%); South Africa controls platinum (70.6%), rhodium (80%), palladium (36.8%), and manganese (38%); Guinea leads bauxite mining (34.1%); Gabon and Ghana are key manganese producers. This upstream concentration creates supply chain vulnerabilities tied to governance stability, infrastructure quality, and trade policy uncertainty in these regions. The report notes that tantalum supply is particularly opaque because "artisanal mining dominates and related cross-border smuggling is commonplace in Africa, so country statistics are probably not accurate."
The Nordic region has limited presence in global CSRM rankings. Finland appears only as the second-largest cobalt refiner (6%), and Norway as the third-largest silicon metal smelter (2.8%). This limited upstream and midstream presence reinforces the report's core finding: the Nordic region is best understood as a "selectively strong value-chain actor rather than a fully self-sufficient system." While the Nordic countries hold substantial geological resources for many CSRMs, their global production and processing shares remain small relative to dominant producers like China, the DRC, and South Africa. However, this also represents an opportunity—developing Nordic resources and processing capacity could meaningfully contribute to European supply diversification.

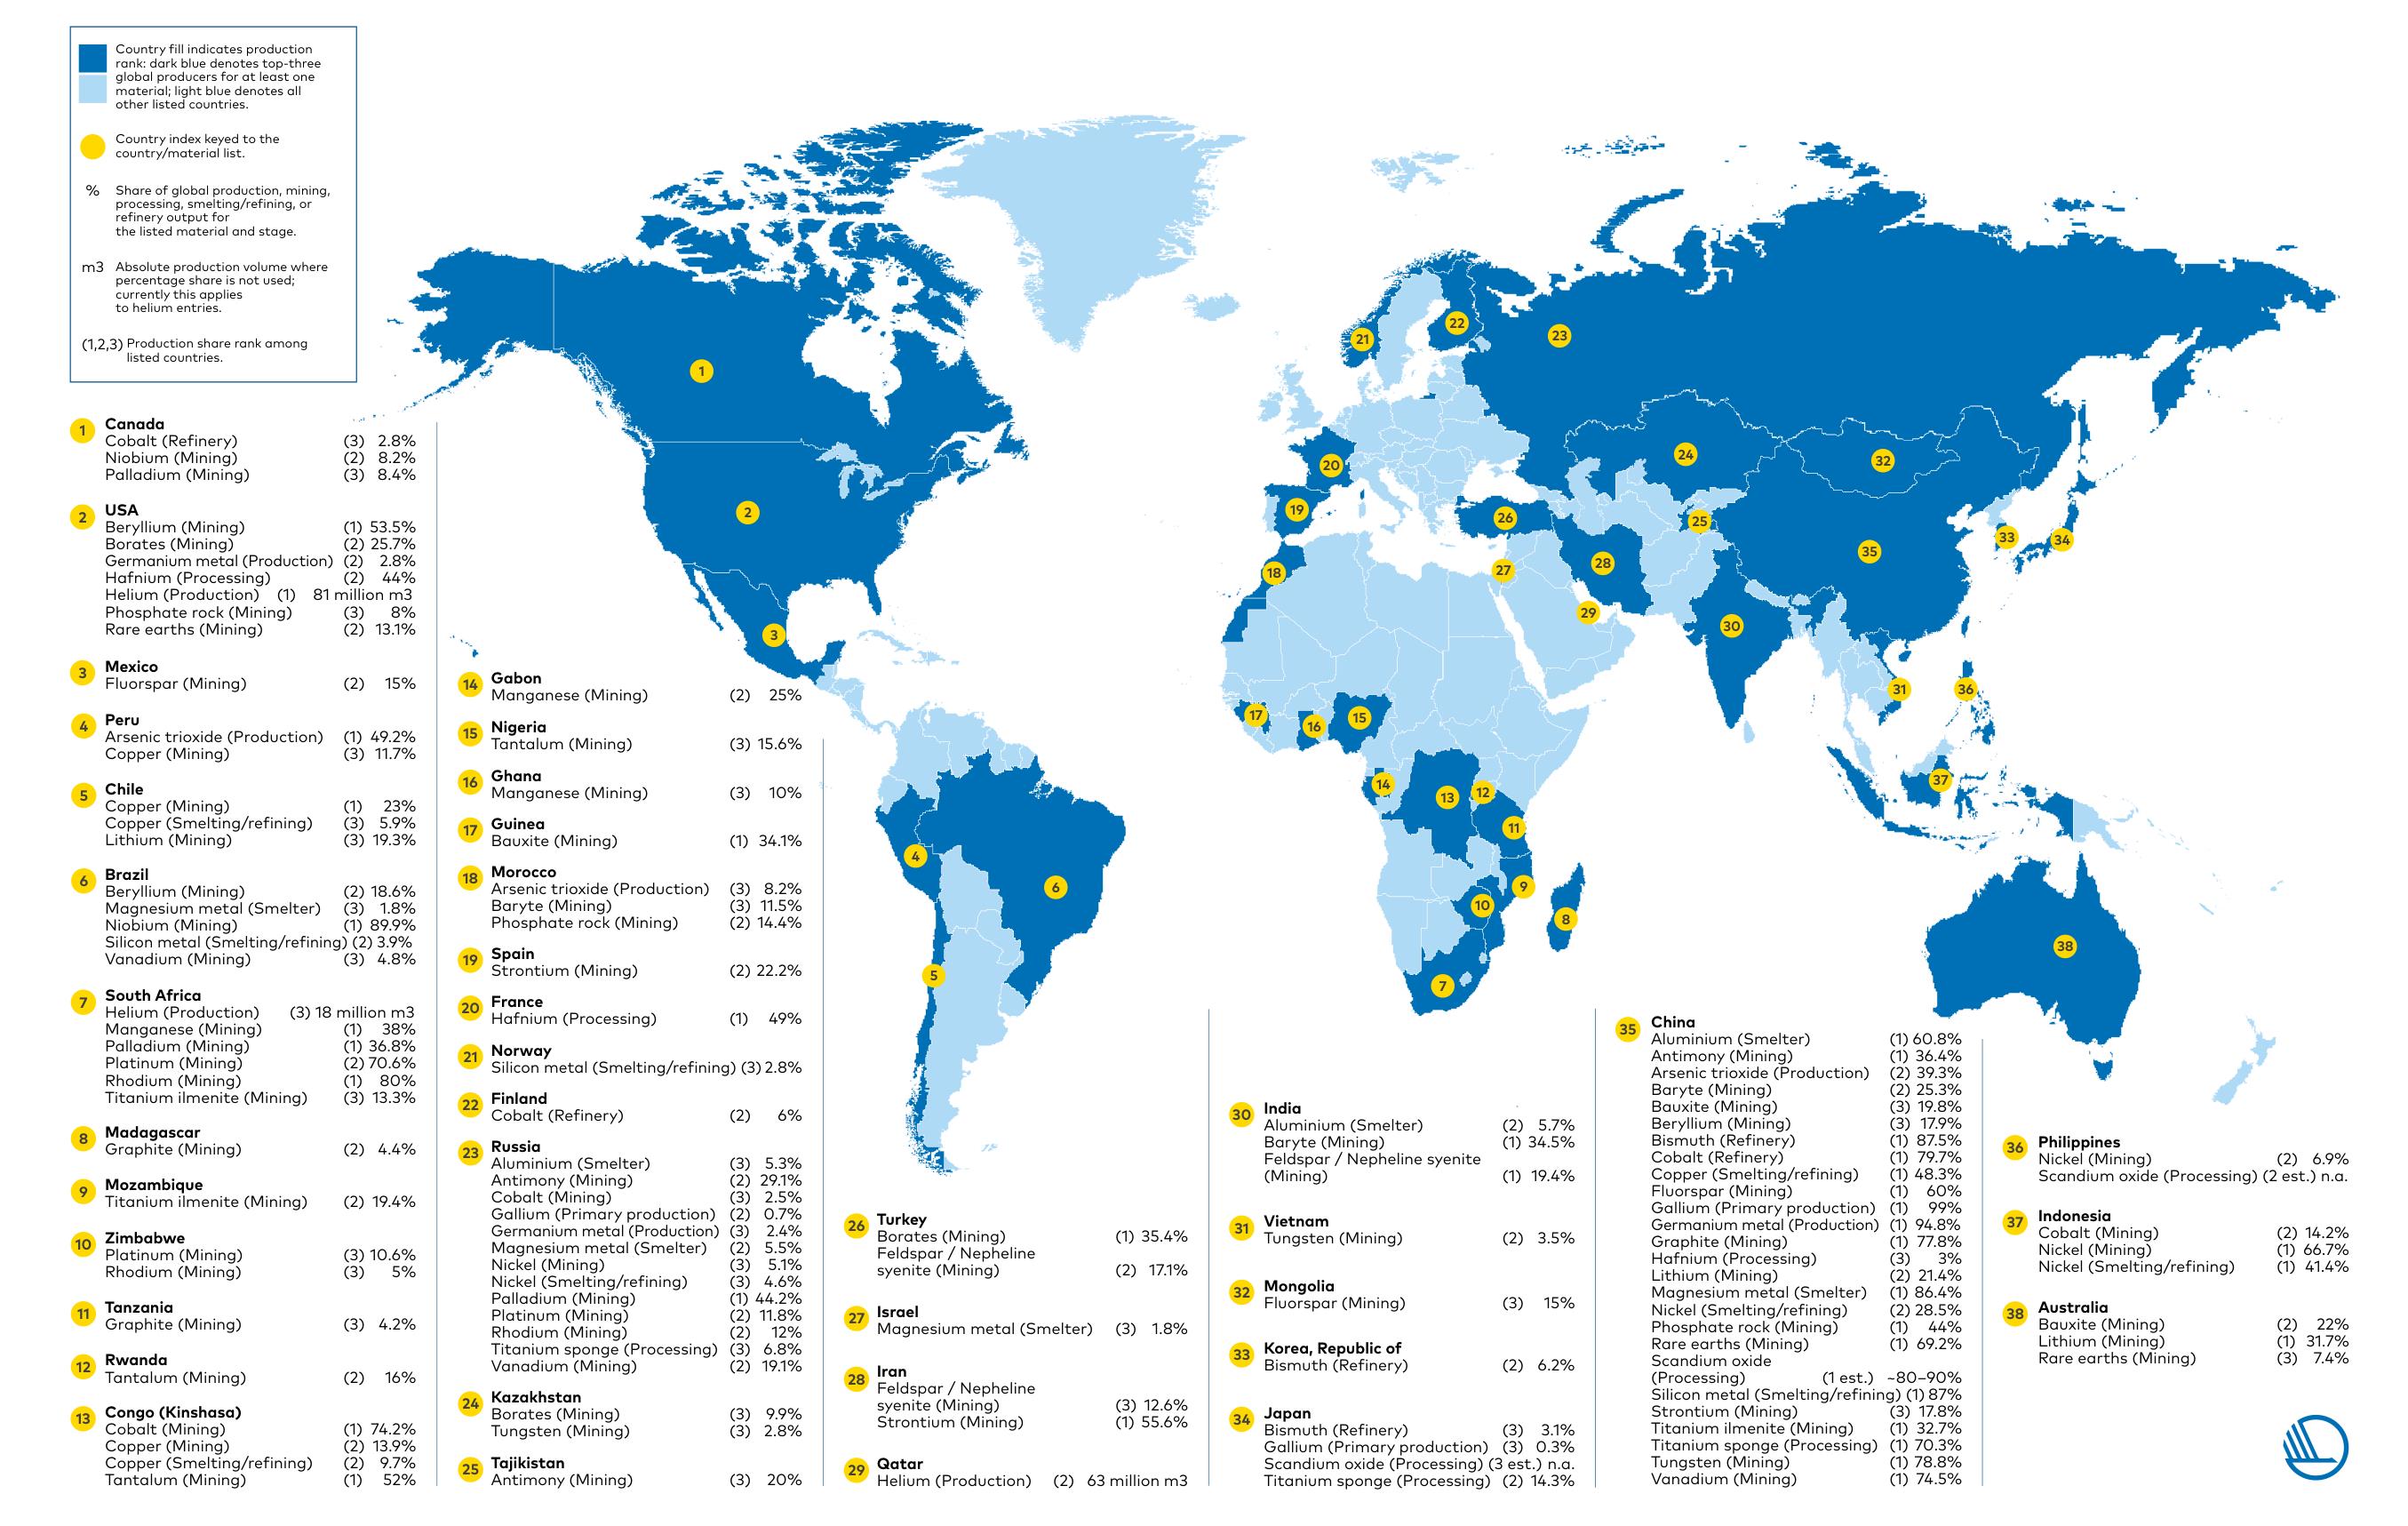
Nordic Innovation report maps the global supply chain for critical and strategic raw materials (CSRMs), listing top-three producers by material and processing stage across 34 countries. China leads in 28+ entries across mining, refining, and smelting—including aluminum smelting (60.8%), cobalt refining (79.7%), rare earths mining (69.2%), graphite mining (77.8%), and tungsten mining (78.8%). The Democratic Republic of Congo dominates cobalt mining (74.2%) and tantalum mining (52%), while South Africa controls platinum mining (70.6%) and palladium mining (36.8%). The United States leads in beryllium mining (53.5%) and helium production (81 million m³). This supply chain map reveals extreme geographic concentration across multiple CSRMs, highlighting Europe's structural dependence on a limited number of producer countries.Data source: USGS MCS 2026, BGS World Mineral Statistics 2023, SCREEN3 2025, Johnson Matthey





 原图定位
原图定位