Note: EUTL verifed emissions for 2025adjusted to account for incomplete reporting using'carrying forward techniques. efficiency of the smelting process, and to the drop in production, Cement clinker: GHGs improvements as from 2019, motivated by by high gas prices, lower capacity, and restructuring in the sector Glass: Continuous GHGs improvements across all glass sectors, electrification, decarbonised raw materials, switching to renewable efficiency. In the 2020s, the carbon intensity starts to be driven by output destruction (caused by high energy and raw material prices). other combustibles or feedstock. This partially off-set the gains in Europe; abatement options (electric arc furnace and direct reduced iron plants) are highly CapEx and OpEx intensive.

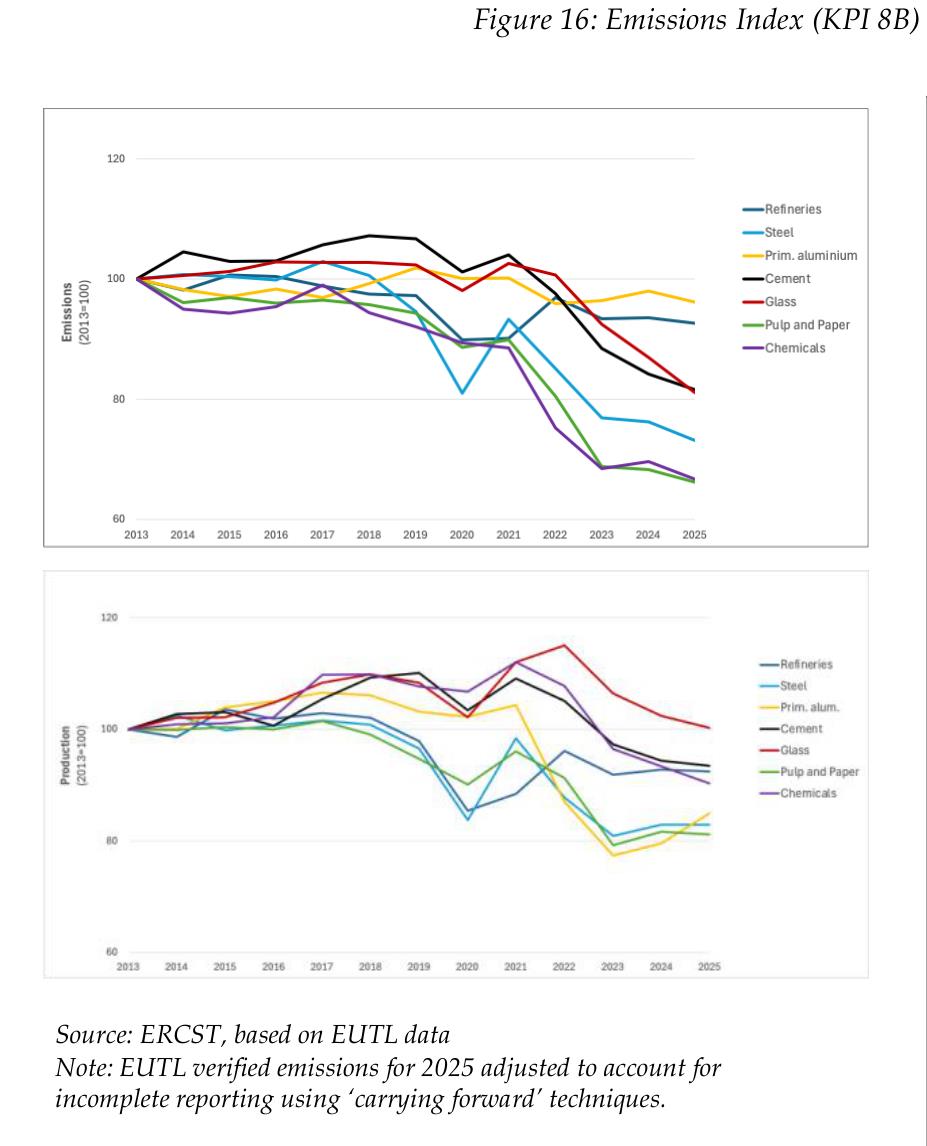
Note: EUTL verifed emissions for 2025adjusted to account for incomplete reporting using'carrying forward techniques. efficiency of the smelting process, and to the drop in production, Cement clinker: GHGs improvements as from 2019, motivated by by high gas prices, lower capacity, and restructuring in the sector Glass: Continuous GHGs improvements across all glass sectors, electrification, decarbonised raw materials, switching to renewable efficiency. In the 2020s, the carbon intensity starts to be driven by output destruction (caused by high energy and raw material prices). other combustibles or feedstock. This partially off-set the gains in Europe; abatement options (electric arc furnace and direct reduced iron plants) are highly CapEx and OpEx intensive.


 原图定位
原图定位