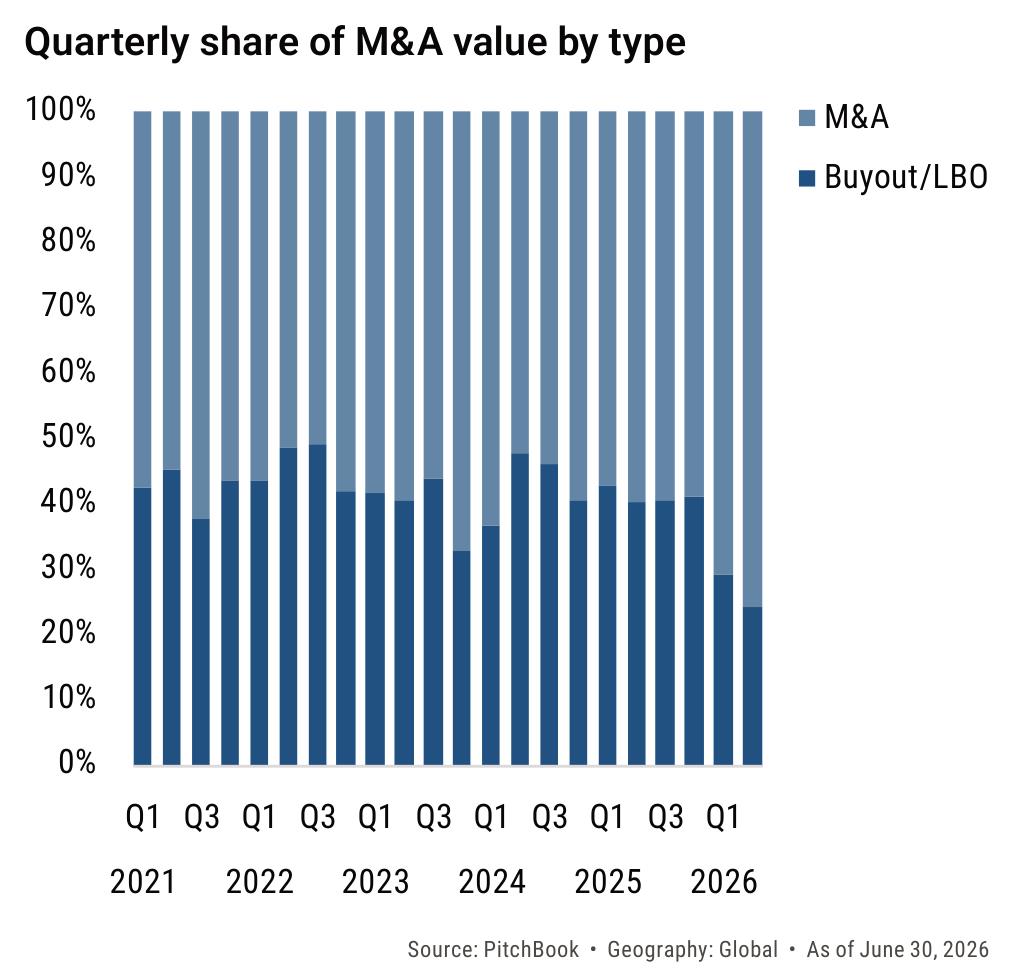
Quarterly share of M&A value by type
Source: PitchBook · Geography: Europe · As of June 30, 2026 and the AES utility acquisition in Q1 2026, but conditions did not support such an appetite in Q2. The result was a period in which corporates, funding deals from balance sheets and was another key theme in Q2, with private equity (PE) retreating as volatility picked up and inflation became a growing concern. stock, held a structural advantage over sponsors dependent on increased between the March and June meetings, and the first time since 2023.1.2 Together, those moves made the as the region's own activity declined. On a YTD basis, North math underpinning leveraged buyouts harder to pencil out, drew $276.7 billion across 645 deals, while European targets transformational platform bets. Strategics filled the vacuum, acquired by non-European buyers attracted $207.6 billion across 819 deals. North America remains the primary magnet for global capital, a status reinforced by the concentration of large US strategic transactions in Q2. The May 2026 as an invitation to pursue scale, moving on deals that would implementation of the US-EU tariff framework, which caps have drawn greater regulatory resistance in prior years.3 tariffs on US industrial goods, has reduced one source of Buyout value fell to $287.3 billion, down 35.7% QoQ and well considerations for acquirers modeling supply-chain exposure.4 below its cycle peak. Strategic M&A value held up far better at $892.7 billion. Sponsors had shown an appetite for large

Source: PitchBook · Geography: Europe · As of June 30, 2026 and the AES utility acquisition in Q1 2026, but conditions did not support such an appetite in Q2. The result was a period in which corporates, funding deals from balance sheets and was another key theme in Q2, with private equity (PE) retreating as volatility picked up and inflation became a growing concern. stock, held a structural advantage over sponsors dependent on increased between the March and June meetings, and the first time since 2023.1.2 Together, those moves made the as the region's own activity declined. On a YTD basis, North math underpinning leveraged buyouts harder to pencil out, drew $276.7 billion across 645 deals, while European targets transformational platform bets. Strategics filled the vacuum, acquired by non-European buyers attracted $207.6 billion across 819 deals. North America remains the primary magnet for global capital, a status reinforced by the concentration of large US strategic transactions in Q2. The May 2026 as an invitation to pursue scale, moving on deals that would implementation of the US-EU tariff framework, which caps have drawn greater regulatory resistance in prior years.3 tariffs on US industrial goods, has reduced one source of Buyout value fell to $287.3 billion, down 35.7% QoQ and well considerations for acquirers modeling supply-chain exposure.4 below its cycle peak. Strategic M&A value held up far better at $892.7 billion. Sponsors had shown an appetite for large




 原图定位
原图定位